Markets
4 Minutes
Technical analysis uses past market events as a basis for forecasting the future. Should investors be worried now?
Long-term fundamental considerations are often of little help to traders with a short-term focus. However, trend lines, resistance and support levels also serve as guidance for many other investors. The more investors pay attention to a specific chart pattern and align their behaviour accordingly – such as selling when a “key support level” is breached – the more likely it is that technical analysis will exert real influence on market movements.
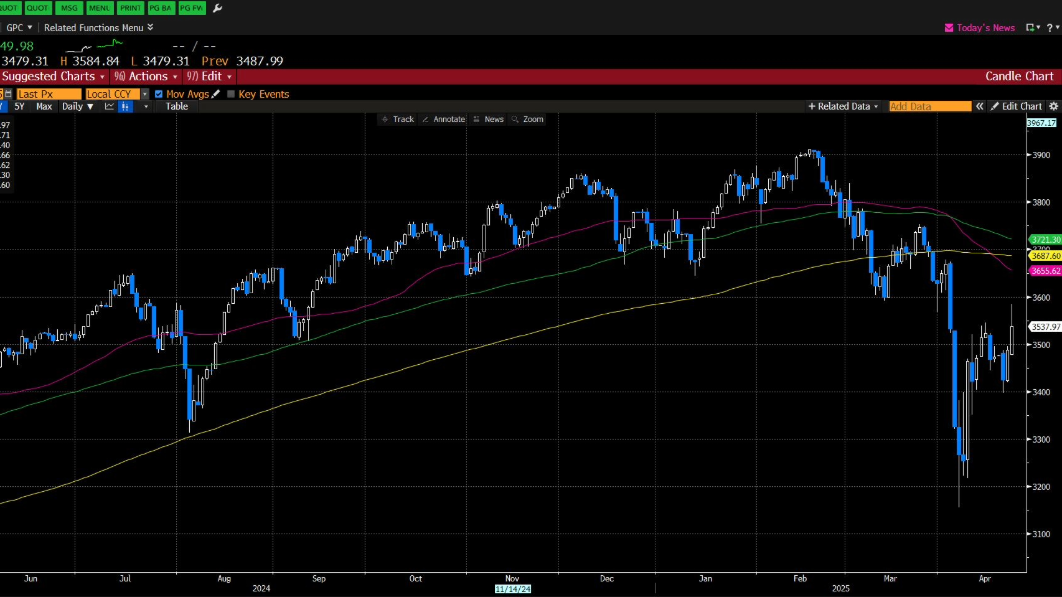
Much in technical analysis is, of course, in the eye of the beholder. Other constellations, however, can be determined objectively. One example is the ‘death cross’, where the moving average of the last 50 trading days falls below that of the last 200 trading days. The name alone suggests something ominous. And because the death cross has appeared in a number of prominent equity indices (including MSCI World, S&P 500, Dow Jones and Nasdaq 100) in recent days, it has become one of the most widely discussed chart patterns in the financial markets today. But is this concern justified?
What does the data say?
If a pattern can be determined as easily and precisely as the intersection of two moving averages, it is also easy to check how reliable the forecasts derived from it are. Take the S&P 500, for example, which has seen 25 death crosses since the late 1920s. In fact, the index performed two per cent worse on average over the following month. Over a period of three or six months, however, there is no significant difference, and over a year, the S&P 500’s performance after a death cross is 9.45 per cent (median) above the annual average since 1929 (which was 7.72 per cent).
The statistics are even better for other indices. Those examining death crosses in the Nasdaq Composite or Nasdaq 100 will find that performance over the subsequent year tends to exceed the long-term average even more clearly.


About the author
Thomas
Lehr
Kapitalmarktstratege bei der Flossbach von Storch SE.


LEGAL NOTICE
One of the purposes of this publication is to serve as advertising material.
The information contained and opinions expressed in this publication reflect the views of Flossbach von Storch at the time of publication and are subject to change without prior notice. Forward-looking statements reflect the judgement and future expectations of Flossbach von Storch. Actual performance and results may, however, differ materially from such expectations. All information has been compiled with care. However, no guarantee is given as to the accuracy and completeness of information and no liability is accepted. The value of any investment can fall as well as rise and you may not get back the amount you invested
This publication does not constitute an offer to sell, purchase or subscribe to securities or other assets. The information and estimates contained herein do not constitute investment, legal and/or tax advice or any other form of recommendation. In particular, this information is not a replacement for suitable investor and product-related advice and, if required, advice from legal and/or tax advisers.
This publication is subject to copyright, trademark and intellectual property rights. The reproduction, distribution, making available for retrieval, or making available online (transfer to other websites) of the publication in whole or in part, in modified or unmodified form is only permitted with the prior written consent of Flossbach von Storch.
Past performance is not a reliable indicator of future performance.
© 2025 Flossbach von Storch. Alle Rechte vorbehalten.